Pick a dataset by your exact driving research question
You can’t pick a driving dataset by popularity and hope it lines up later. Start with a single sentence that names your output and its use: “3D vehicle detection at 30–60 m for urban driving,” “multi-object tracking with long occlusions,” “pedestrian intent prediction at intersections,” or “lane topology for HD-map updates.” That wording forces decisions about coordinate frames (2D image boxes vs 3D boxes), time (single frames vs sequences), and what “good” means (AP, MOTA, minADE, map accuracy).
Write down what must be true for your experiment to count as success: target classes, range, speed regime, weather/day-night, and whether you need raw sensors or only annotations. A tracking paper that needs 10-second continuous scenes will fail on datasets dominated by short clips; a model meant for highway merges will look strong on downtown-only footage for the wrong reasons. This is also where costs show up: training a LiDAR-heavy baseline can require multi-terabyte storage and longer iteration cycles than a camera-only setup.
Finally, list two “deal-breakers” and two “nice-to-haves” before you browse options. Deal-breakers are things like “must include 3D boxes with velocity,” “must have synchronized radar,” or “must allow commercial use.” Nice-to-haves might be “multiple cities” or “dense instance segmentation.” With that list, you can reject most datasets quickly and spend your time comparing only the few that actually match the question you’re trying to answer.
Decide what you must observe: cameras, LiDAR, radar, maps
Once your outputs are defined, choose the minimum set of observations that can actually produce them. Cameras are strong for semantics (signals, lane paint, intent cues) and cheap to store, but depth is indirect and performance can swing with glare, rain, and night. If your metric depends on 3D position and size at longer range, a dataset with calibrated LiDAR often turns “guessing depth” into a geometry problem you can measure, at the cost of heavier files and slower training loops.
Radar is easy to overlook until you need stable velocity in bad visibility or you care about far-range tracking. Many public datasets include radar but with sparse returns, tricky artifacts, or limited label support, so check whether radar is synchronized, calibrated, and actually used in the provided benchmarks.
Maps matter when your task requires lane topology, right-of-way, or long-horizon prediction. If an HD map is included, confirm the coordinate frame, update frequency, and whether you can redistribute derived map products under the license.
Scope matters: where, when, and how diverse the data is
A model that looks great on one city’s downtown grid can fall apart on a different road culture, camera mounting height, or lane-marking style. Treat “scope” as a set of hidden assumptions: geography (countries, cities, road types), time (season, time of day), and operating design domain (speed ranges, construction zones, tunnels, bridges). If your dataset is mostly clear-weather daytime, you may end up measuring how well you fit that lighting profile, not how well you detect or track.
Diversity is also about distribution, not just a long list of conditions. A dataset can claim rain and night yet contain too few usable scenes to move your metrics. Check how many hours or frames actually cover your hard cases, and whether they appear in both train and test. Watch for scope costs: adding “more places and more conditions” often means more calibration quirks, inconsistent signage, and heavier preprocessing to normalize coordinate frames and timestamps across scenes.
Labels and ground truth: what exists and what’s missing
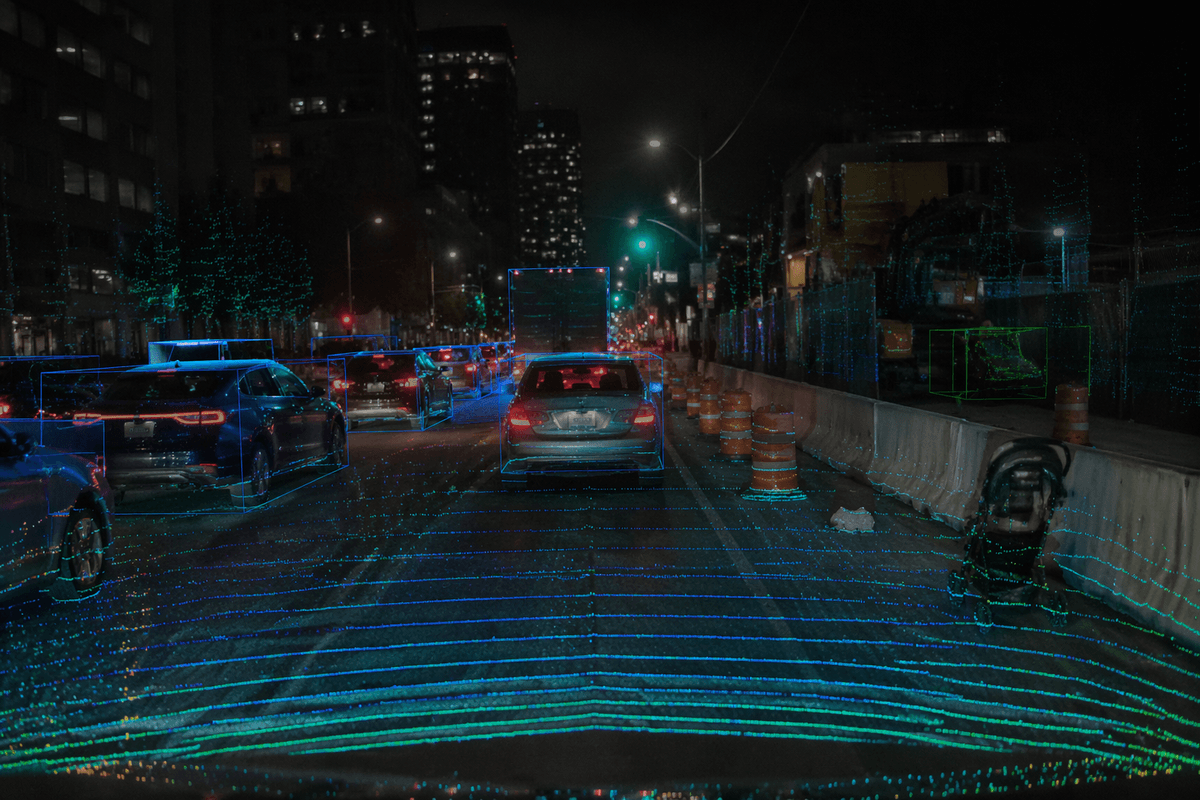
Two datasets can share the same sensors and still behave very differently because of labels. Start by checking what “ground truth” actually means: 2D boxes, 3D boxes, tracks, velocities, instance masks, lane boundaries, map elements, traffic-light state, or intent and future trajectories. Then look at how it’s defined. A 3D box might be tight-to-visible surfaces in LiDAR, an amodal box that guesses occluded extent, or a box tied to a specific object frame; those choices change what errors your model is allowed to make.
Missing labels are usually the real constraint. Many datasets label only a few classes (often cars, pedestrians, cyclists) and ignore debris, cones, strollers, animals, and unusual vehicles, which can quietly break open-world or safety-focused experiments. Tracking labels may drop IDs through occlusion, and “velocity” may be derived from box differences rather than measured, which matters for motion forecasting. Even when labels exist, annotation density varies: keyframes vs every frame, full scene graphs vs only near-range actors.
Plan for the cost of label mismatch early. If you need panoptic segmentation but only boxes are available, you’re signing up for extra modeling assumptions or new annotation work; both can dominate your timeline. A quick sanity check is to sample a few sequences and manually inspect edge cases—night scenes, heavy traffic, construction—so you see where the ground truth becomes sparse, inconsistent, or simply absent.
Quick tour of widely used public driving datasets
If you want a fast baseline for 3D detection with LiDAR, KITTI is still a common reference point because it’s small, well understood, and easy to iterate on. The downside is scope: limited geography, older sensor setup, and relatively few scenes, so it’s easy to overfit to its quirks. For multi-sensor urban perception, nuScenes is a go-to because it pairs 360° cameras with LiDAR and radar and provides sequences with tracking and basic prediction targets. Its labels are practical, but radar and velocity fields can be easy to misuse if you don’t follow the dataset’s conventions.
For large-scale 3D detection and tracking, Waymo Open Dataset is a frequent choice due to volume and label richness, especially for long-range LiDAR-based evaluation. It also tends to push you into heavier storage and longer training cycles, and the tooling assumptions can shape your pipeline. Argoverse 2 is often picked when you care about mapping context (lane topology) alongside detection and tracking, but you’ll spend time aligning coordinate frames and map semantics with your task.
Cityscapes and BDD100K remain useful when your work is camera-first (2D detection, segmentation, domain shift), but they won’t solve 3D geometry without extra assumptions. You can mix one “sensor-rich” dataset for core metrics with one “camera-diverse” dataset to test robustness, as long as you budget time for label harmonization.
Licensing, privacy, and sharing: avoid downstream research blockers

You might find a dataset that matches your sensors and labels perfectly, then discover the license blocks the work you actually want to publish or deploy. Before you download terabytes, check whether commercial use is allowed, whether you can redistribute the raw data, and whether you can share derived artifacts like trained weights, pseudo-labels, or updated maps. Some licenses allow papers but prohibit releasing model outputs that could re-identify locations or people.
Privacy constraints show up in practical ways: blurred faces and plates can break re-identification or fine-grained pedestrian studies, and some datasets restrict showing frames in talks, demos, or repos. Sharing can be the hidden trap—your lab’s “reproducible benchmark” isn’t reproducible if others can’t access the same split, the same sensor logs, or the same evaluation server. If you anticipate collaborations, pre-negotiate what can go on GitHub and what must stay behind access controls.
Make it usable: splits, benchmarks, and common evaluation traps
The fastest way to waste a month is to treat “train/val/test” as a folder structure instead of a design choice. Use official splits when they exist, but verify what they actually prevent: many driving datasets split by scene, yet still leak location, lighting, or sensor setup across splits. If your goal is generalization, add an explicit “held-out domain” split (a city, a weather bucket, or a time-of-day) and keep it untouched until you stop changing modeling decisions.
Benchmarks also encode assumptions. Some evaluations ignore classes you care about, clip ranges, or score only at certain distances; others bake in coordinate-frame conventions that quietly penalize correct predictions. Tracking and prediction are especially fragile: resetting IDs at scene boundaries, evaluating only keyframes, or mixing interpolated labels with per-frame outputs can inflate numbers. Budget time for an evaluation harness you trust—parsing, timestamp alignment, and sensor calibration checks are dull, but they are where most “state-of-the-art” gains disappear.
When public data isn’t enough: augment, simulate, or collect
You’ll hit a point where the public dataset is “close” but not decisive: your failure modes sit in rare weather, unusual actors, or a specific sensor stack that no benchmark matches. Augmentation is the cheapest first move, but be honest about what it can and can’t create. Photometric tweaks help cameras; geometry-preserving transforms help LiDAR; synthetic occluders or copy-paste can increase density. None of these reliably adds truly new road layouts, traffic rules, or long-tail behaviors, and aggressive augmentation can shift the data so far that your metric stops reflecting the original task.
Simulation helps when you need controlled counterfactuals—more near-misses, more night intersections, more radar in fog—but it comes with integration costs. You still need calibration, sensor noise models, and labeling rules that match your evaluation, or you end up training to a different world. Collecting real data is the most expensive option, yet sometimes the only way to validate a claim. Even a small targeted capture (a few hours) can be enough if you design it around your “deal-breakers” and label only what your metric needs.
A simple shortlist checklist to choose confidently
You end up choosing faster when you force a short comparison table. Write your research sentence, then score each candidate dataset on five checks: (1) required outputs exist (2D/3D boxes, tracks, trajectories, maps) in the definition you need; (2) sensors and calibration support your metric (sync, frames, timestamps); (3) scope matches your target domain, and your hard cases appear in both train and test; (4) splits and official metrics won’t leak or hide failures; (5) license allows your intended release (code, weights, derived artifacts). If two datasets tie, pick the one you can preprocess and evaluate end-to-end in a week.